Data Analysis
Data analysis is the process of inspecting, cleaning, transforming, and modeling data to discover useful information, draw conclusions, and support decision-making. This repository contains tools, scripts, and examples related to data analysis.
Getting Started
To get started with data analysis using this repository, follow these steps:
- Clone the repository to your local machine using git clone.
- Set up the required environment, such as installing Python packages using pip or creating a virtual environment.
- Explore the various folders to find different data analysis examples and tools.
Resources
Include any additional resources, tutorials, or guides that might be useful for data analysis in this section. For example:
Useful Links
- Data Analysis with Python - DataCamp
- Data Analysis Tutorials - Kaggle
- 101 DATA SCIENCE with Cheat Sheets - Medium
- Information is Beautiful
- Data, information, knowledge: it transform them into beautiful, useful graphics & diagrams.
- Infogram
- Infogram uses infographics which are graphic visual representations of information, data, or knowledge intended to present information quickly and clearly. They can improve cognition by using graphics to enhance the human visual system’s ability to see patterns and trends.
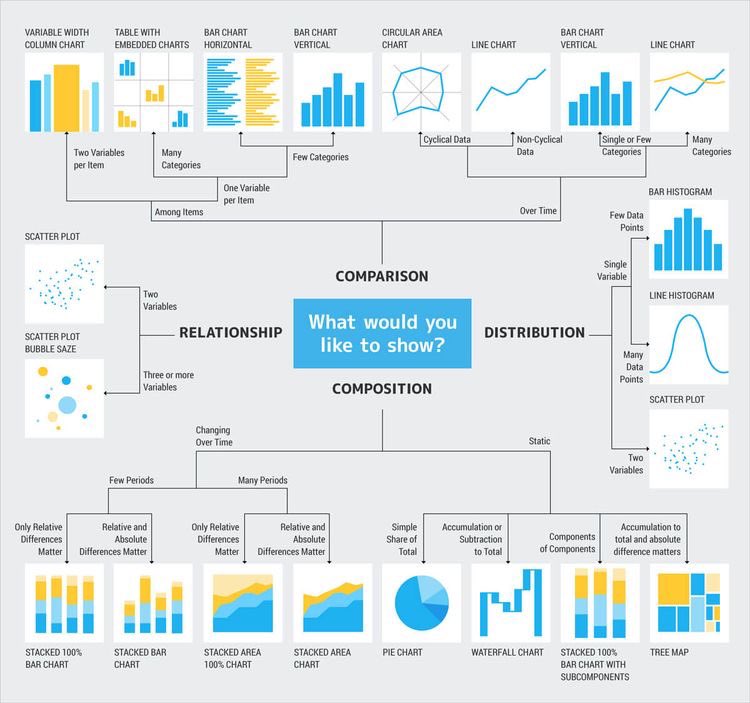
- Guide for Choosing Appropriate Charts
- To describe a single variable - BAR CHART
- To visualize the distribution of a variable - HISTOGRAM
- To compare the strength of association between 2 variables - SCATTER PLOT
