In-Depth Zabbix
TLDR:
- Analyzing Issues: Use Monitoring > Problems and Monitoring > Latest data to review and analyze historical issues.
- Network Map: Create and customize network maps through Monitoring > Maps, adding objects and configuring map settings.
- Discovery Rules: Automate server monitoring with Discovery Rules in Configuration > Discovery, including actions and filters for automatic configuration and notifications.
This guide also covers creating and managing user groups, configuring permissions and access settings, adding new users, setting up media notifications, integrating LDAP for authentication, and using custom scripts in Zabbix.
The installation and basic usage scenarios of Zabbix, an open-source software for monitoring servers and systems, were covered here. This article delves into more detailed usage scenarios.
Analyzing Issues
Monitoring systems continuously for real-time issues is not always feasible. Sometimes, historical reviews are needed to identify problems. The first place to perform such reviews is the Monitoring > Problems section.
Filters can be applied in this section to analyze issues across the system. Detailed explanations of the filters are not provided here, but any questions about specific filters can be addressed in the comments.

Another location for historical monitoring is Monitoring > Latest data. While the Problems section shows triggered values for the triggers, this section allows inspection of item-specific data within hosts. Clicking the Graph button next to listed items will display historical data collected by the selected item.


Switching the View as option from Graph to Values will list the obtained values. The 500 latest values option displays the last 500 values collected by the item.

Creating a Network Map
One of Zabbix’s appealing features is the ability to create network maps. This allows visual representation and monitoring of network topology. To create a new network map, navigate to Monitoring > Maps and click the Create map button in the top right corner.

After configuring settings in the Map tab, click the Add button to start editing. These settings can later be adjusted by clicking the Properties button next to maps in Monitoring > Maps. The Sharing tab allows specifying who can view the map.


A 800x600 pixel workspace opens. To add a new object, use the Add button next to the Map element section in the top left.

An interface opens to define the object’s function, appearance, and label placement:
- Type: Select the type of object (e.g., Host, Host Group, Trigger, or Map). Additional settings will vary accordingly.
- Label: Assign a label to the object, which can be customized in map settings with macro definitions.
- Label location: Choose the label’s location.
- Application: Displays problems for triggers in the Application defined within host definitions.
- Icons: Select icons for various states, with options to add custom icons and gifs.
- Coordinates: Adjust the position of objects pixel-by-pixel.
- URLs: Create a list of URLs that appear when the object is clicked.
A sample system map is shown below, demonstrating both cabinet placement and topological designs.

To add the finished map to the Dashboard, switch to edit mode, click Add widget, select Map as the type, and give the widget a name. Choose the previously created map from the Map option and click Add.


If an issue occurs with any object, it will be displayed as shown below. Custom shapes or gifs can be used to represent errors as desired.

Defining Discovery Rules
Discovery Rules automate the addition of newly added servers to the monitoring screen without manual intervention. They also allow selection of host groups and templates. Here’s how to define Discovery Rules.
Navigate to Configuration > Discovery and click the Create discovery rule button in the top right.
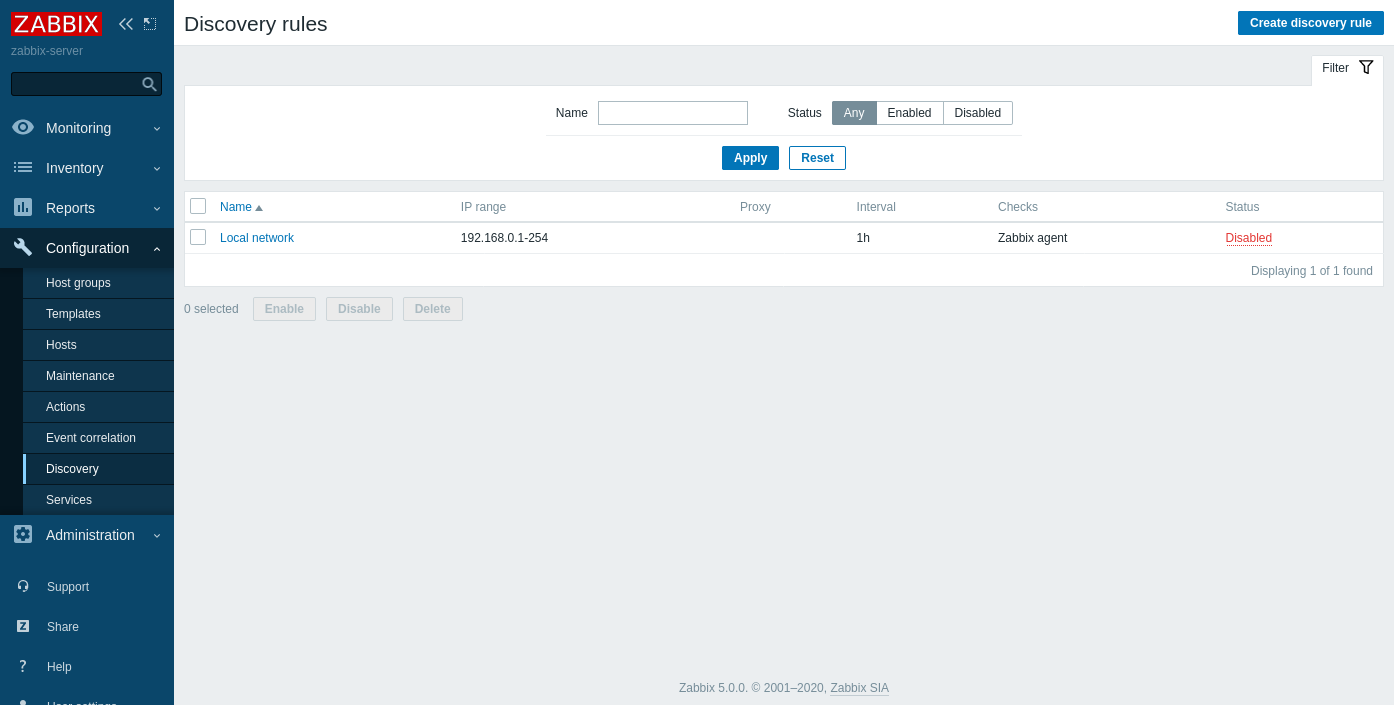
This section defines criteria for scanning servers.
- IP range: Define multiple IP ranges separated by commas.
- Update interval: Specify how often to check the defined IP range.
- Checks: Select parameters or definitions to check within the range.
- Device uniqueness criteria: Determine how uniqueness is identified. Existing devices matching this criterion will not be reprocessed.
- Host name and Visible name: Define how these fields will be populated.

In the Checks section, click Add and specify the type of check desired. For instance, checking the system.uname parameter helps identify Linux systems based on the uname output. (Ensure the key is defined on the agent or as an item; system.uname is a default parameter.)

The final definitions include setting uniqueness criteria based on IP address, and filling Hostname and Visible Name with the system.hostname information from the Zabbix agent.

Next, proceed to the Trigger actions page by selecting Trigger actions and clicking Create action.


In the Actions section, apply filters to discovered devices. Select servers matching the “Zabbix Network” Discovery rule with parameters including Linux.
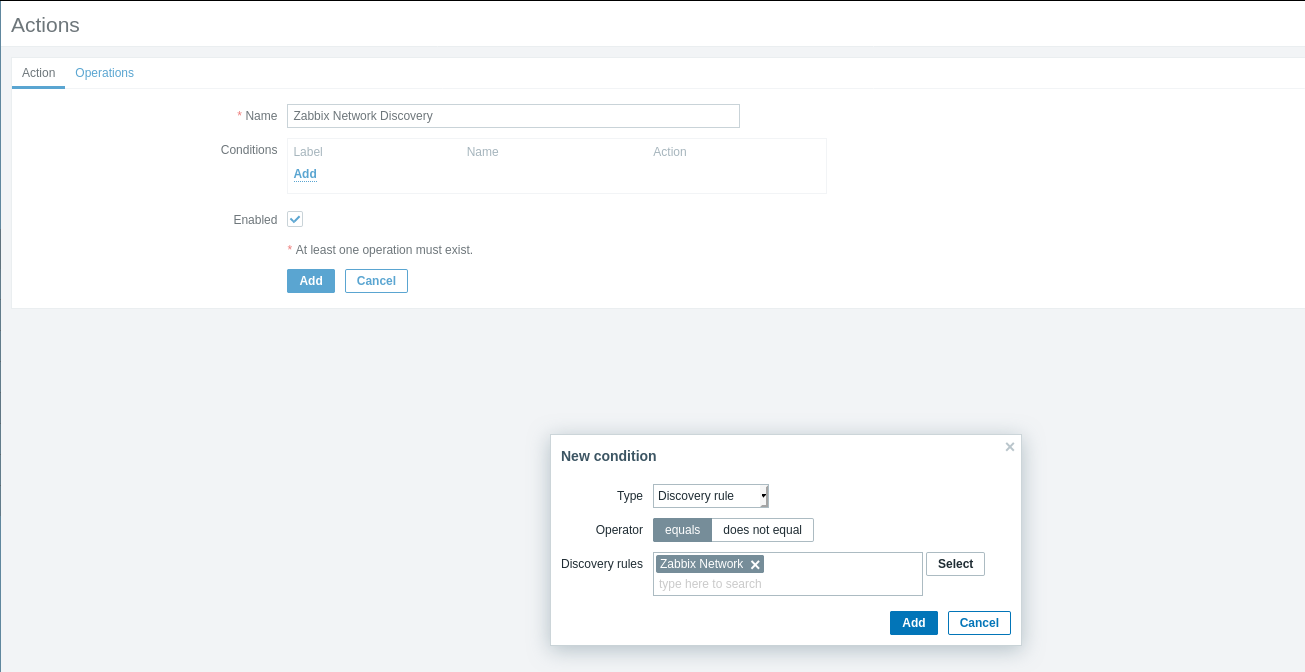
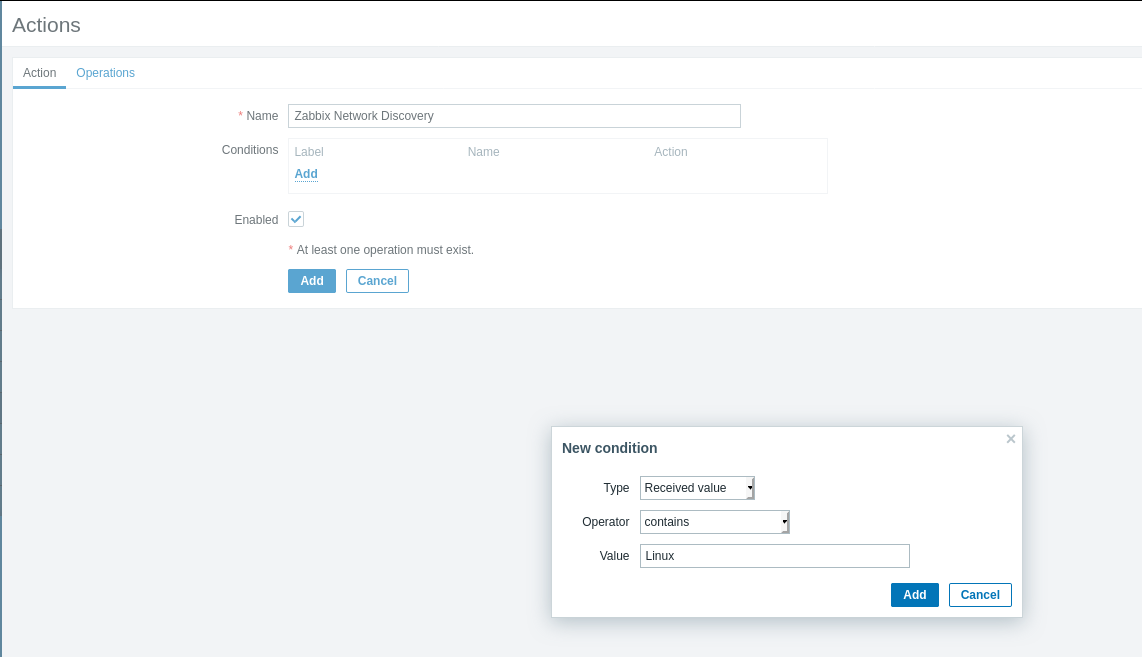
Configure actions as needed, similar to trigger actions, setting priorities and automatic configurations for the newly discovered devices.

Operations in the Actions section involve configuring discovered devices based on applied filters. Host groups and inventory information are set, and templates are applied. Additionally, notifications can be configured.

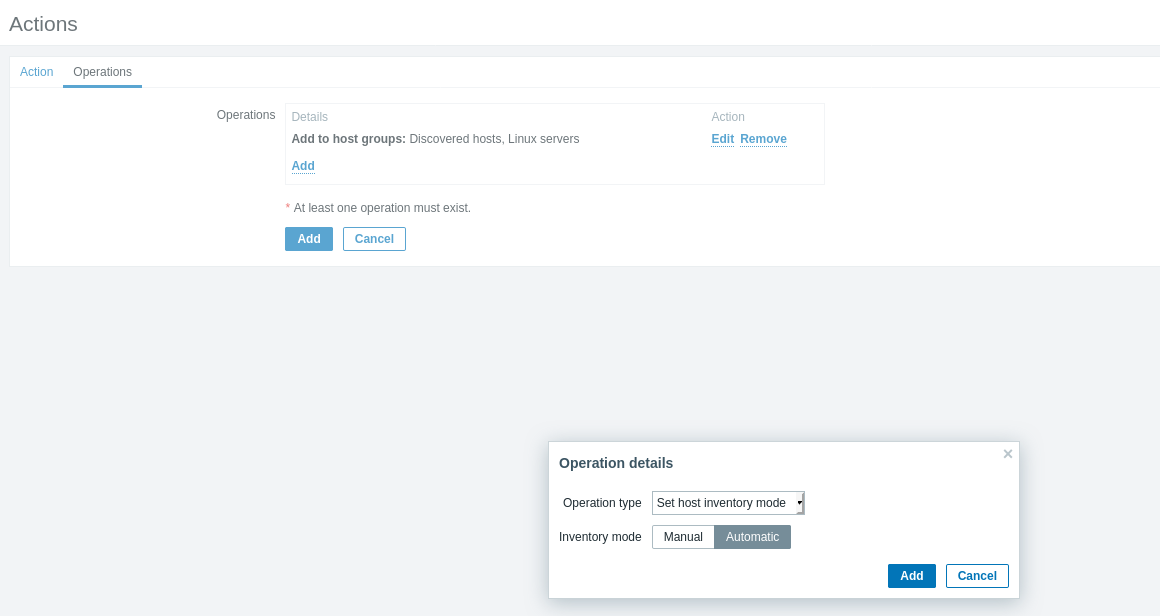


Final configurations ensure that newly added servers and devices are monitored according to the defined rules.

User Groups
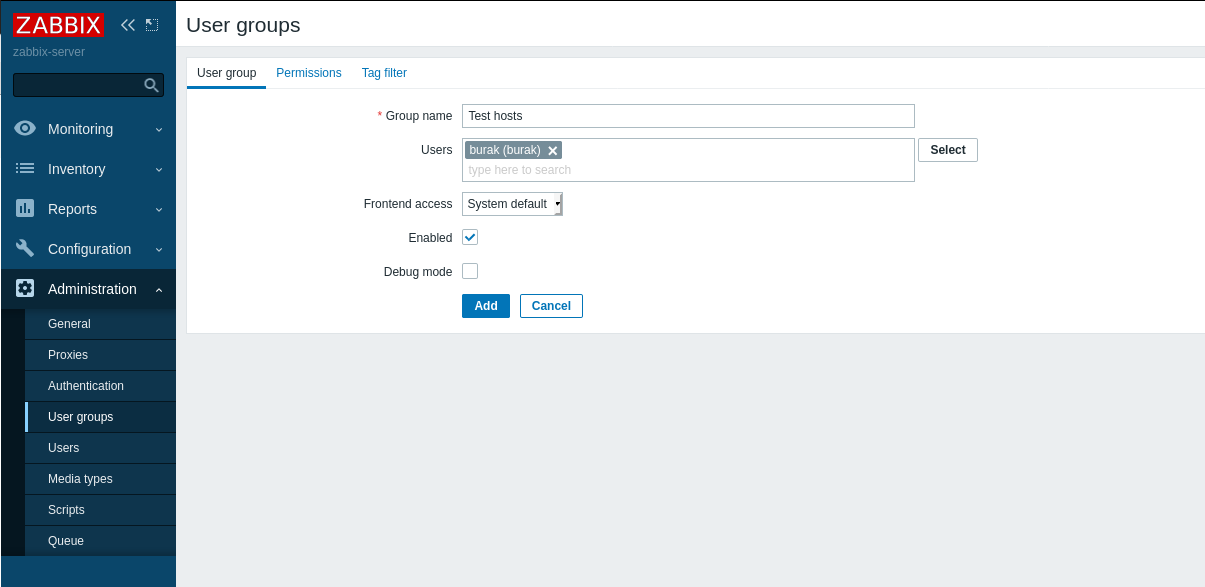
- Creating a Group:
- Path: Administration > User Groups > Create user group
- Description: Enter the group name and select users. Configure frontend access settings.

- Permissions:
- Read-write: Users can modify and view parameters.
- Read: Users can only view parameters.
- Deny: Viewing and modification are restricted.
- Include subgroups: Allows hierarchical grouping with subgroups.

- Tag Filter:
- Restrict access to specific servers within a host group based on tags.

Creating Your Own Template
- Create Template:
- Path: Configuration > Templates > Create Template
- Description: Enter basic information for the template.

- Linked Templates:
- Select templates to link. All items and triggers from the linked templates will be included.

- Tags and Macros:
- Define tags and macros for the template.


- Adding Items and Triggers:
- Select items to add to the template and copy them.


- The added items are now available in the template.

Adding Users
- Create User:
- Path: Administration > Users > Create User
- Description: Enter alias, groups, password, language, theme, etc.


- Media Definitions:
- Type: Choose the media method for notifications.
- Send to: Define the notification address.
- When active: Specify active days and times.
- Use if severity: Select severity levels for notifications.
- Enabled: Determine if the media is active or passive.


- User Roles:
- Zabbix User: Read-only access to devices.
- Zabbix Admin: Allows configuration changes.
- Zabbix Super Admin: Full control over Zabbix settings.
LDAP Authentication Integration
- LDAP Settings:
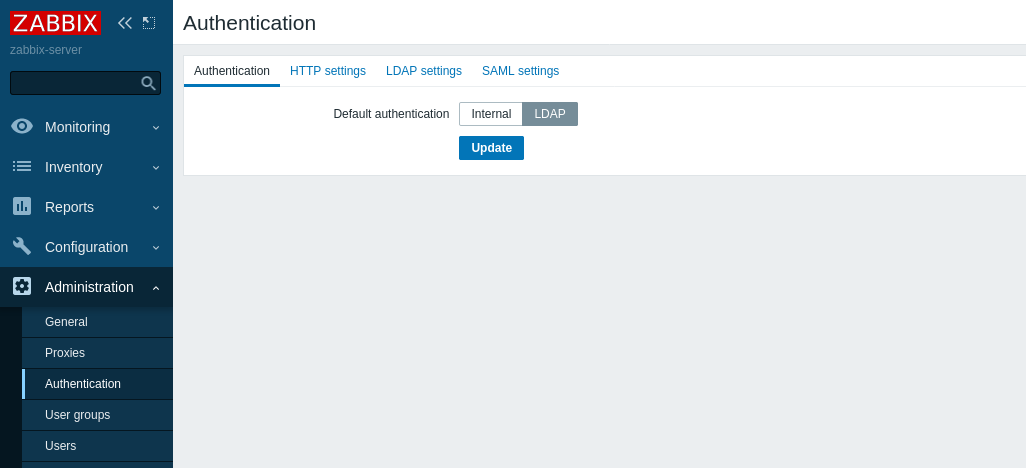
- Path: Administration > Authentication
- Description: Change Default Authentication to LDAP and enter LDAP server details. Test the configuration.

Using Scripts
- Script Configuration:
- Agent Configuration: Add
UserParameter=<key>,<shell command>to the agent configuration file.
[root@zabbix-client burak]# service zabbix-agent2 restart - Agent Configuration: Add
- Item Definition:
- Define the item on the server and test it.


- Monitor the data via Monitoring > Latest.

Ref: Burak Kıymaz